Orange County Housing Report: Sky-High Rates
October 3, 2022
From the lows of 3.22% in January to a high of 6.7% last week, rising mortgage rates have substantially impacted the housing market in so many ways.
The High-Rate Environment
Mortgage rates have more than doubled after ringing in 2022.

Back in 1989, gas prices averaged 99¢. It reached $1.59 in 2000, jumped to $3.11 in 2010, and was nearly unchanged at $3.04 a decade later in 2020. However, in 2021, the price for a gallon of gas jumped from $3.26 in January to $4.60 by year’s end, a 41% increase. It was the largest rise since 2009. In 2022, gas prices soared even higher and sat at $6.40 to start October, up another 43%. Prices had nearly doubled since January 2021. From driving less, to carpooling, to combining errands, to eating out less, at these levels, consumers have adjusted their behaviors.
It has been similar for housing, and an even larger adjustment in consumer behavior, as not only have home values surged higher, so have mortgage rates. The combination of the two has rippled throughout the housing market. In Orange County, according to the Federal Housing Finance Agency Home Price Index, home values rose annually by 4.3% in 2020, the first year of COVID, up 15.9% in 2021, and surged to 22% higher through the 2nd quarter of 2022. That’s when the median value of a detached home stretched to nearly $1.3 million, a mind-blowing 51% higher than January 2020’s $855,000 median. Home values had reached unbelievable heights.
In addition to values rocketing higher this year, so have mortgage rates. Upon ringing in the New Year, according to Freddie Mac’s Primary Mortgage Market Survey®, rates were at 3.22%. They surpassed 4% in March, 5% in April, 6% in September, and reached 6.7% last Thursday, more than double the start to 2022. The combination of higher rates and higher home values has completely flipped housing on its head and consumers have changed their approach to housing.
The ultra-low-rate environment and lack of available homes on the market, which reached record low levels in 2020 and 2021, allowed home values to escalate out of control. Mortgage rates remained at record lows from April 2020, after the start of COVID, through the first week of this year, 21-months straight where they ranged between 2.65% to 3.5%. Despite increasing values, payments for the median priced detached home in Orange County increased from $3,509 in January 2020 to $3,561 in January 2021, a rise of only $52 per month.

Unfortunately, rates remained low, and the inventory dropped to unprecedented levels. A peak of only 2,537 available homes was reached in July 2021, far below the 3-year average peak prior to COVID (2017 to 2019) of 6,959, a mind-blowing 64% less. The inventory had reached catastrophically low levels, which is why home values catapulted to astronomical heights. As a result, payments had reached $4,797 per month in January of this year. As rates shot higher in 2022, so did payments. March’s 4.17% rate and a $1.3 million detached median meant payments had grown to $5,724 per month. Payments stretched to $6,480 in June. As of the end of September, with rates at 6.7%, the payment had jumped to $6,969 per month. For perspective, that is an extra $3,460 per month, or $41,520 more per year, for the median priced detached home in September compared to the median priced detached home in January 2020.

There are many consequences to sky-high rates. Demand has dropped to ultra-low levels. It is 37% lower than last year and 29% lower than the 3-year average prior to COVID. With fewer buyers in the marketplace, foot traffic is way down, OPEN HOUSE attendance is down considerably, multiple offers are the exception and not the rule, sales prices are normally below the asking price, and market times have increased substantially. Buyers are no longer waiving appraisals, waiving inspections, providing free rent backs to sellers, or paying substantially above asking prices. The fewer buyers that remain are taking their time and very carefully approaching the market. In the end, they are absorbing a much higher monthly payment, even with buying down the mortgage rate or going the adjustable-rate route.
Typically, in a year where mortgage rates spike higher, the inventory climbs much higher as well. As homeowners come on the market monthly, they are greeted with muted demand. There are fewer success stories, so these sellers accumulate on the market and the inventory grows. With a rising inventory and dropping demand, market times grow, and it takes much longer to sell. That was the story in 2013 when rates rose from 3.34% at the start of the year to 4.57% in September. The inventory grew from 3,163 in January to its peak of 6,350 homes in October. A normal peak occurs between July and August, but in years where rates substantially rise, the peak is delayed into the Autumn Market as there are more sellers who languish on the market.
This year as rates exploded higher, the inventory grew from 954 homes at the start of the year to a peak of 4,069 at the start of August. It stopped rising early and has dropped to 3,646 today. As a result of sky-high rates homeowners are opting to not sell. They do not want to trade their incredibly low monthly mortgage payment where more than two-thirds of homeowners with a mortgage are enjoying a rate at or below 4%. Many homeowners are hunkering down and opting to stay even if they have an itch to make a move. In fact, there were 784 missing FOR-SALE signs in July, 21% fewer, 1,051 missing signs in August, 30% fewer, and 728 missing in September, 24% fewer. The lack of new sellers is preventing the inventory from growing despite demand falling an additional 13% in the past four weeks.
The Expected Market Time, the amount of time between coming on the market to opening escrow, has grown from 19 days in March to 68 days today. Normally, anything between 60 and 90 days is considered a Slight Seller’s Market where sellers get to call more of the shots, there are not as many multiple offers, and home values are only rising slightly. Between 90 and 120 days is a Balanced Market that does not favor buyers or sellers during negotiations and values do not change much. Between 120 and 150 is a Slight Buyer’s Market where buyers get to call more of the shots and home values drop only a bit. Above 150 days is a Deep Buyer’s Market where buyers call the shots and values are dropping.
Yet, this supply and demand model is broken due to today’s unaffordability levels. The further rates surged above 5%, after lingering below 3.5% for so long, the more the pool of prospective buyers evaporated. The remaining buyers are not interested in paying the frothy prices of earlier in the year. They do not want to continue to stretch prices to record territories either. They want to pay the Fair Market Value of a home based upon its condition, location, age, upgrades, and amenities, ignoring buyers who paid tens of thousands of dollars more than the asking price, and even hundreds of thousands of dollars more, during the first half of 2022. According to the Case-Shiller Home Price Index, and other indexes that more accurately determine values than just looking at monthly median sales price, home values started retreating in May.
As long the sky-high mortgage rate environment continues, expect demand to remain muted, values to slowly drop, and fewer homeowners willing to participate in today’s housing market as they continue to hunker down.
Active Listings
The current active inventory remained almost unchanged in the past couple of weeks.
The active listing inventory increased by 8 homes, nearly unchanged, and now sits at 3,646. Typically, during the Autumn Market, the inventory slowly falls. Yet, due to mortgage rates surging higher from 5.66% at the start of September to 6.7% last week, demand continued to rapidly cool, and more sellers languished on the market. Fewer homeowners opting to list their homes FOR-SALE due to the high mortgage rate environment has prevented the inventory from rising faster. The inventory will remain flat, or even rise slowly, if rates stay above 5.75%. Expect the inventory to fall during the Holiday Market, from the week before Thanksgiving to New Year’s Day, as far fewer homeowners opt to sell during the festive season and many unsuccessful sellers throw in the towel and pull their homes off the market.
Last year, the inventory was at 2,179, 40% lower, or 1,467 fewer. The 3-year average prior to COVID (2017 to 2019) is 6,400, an extra 2,754 homes, or 76% more. There were a lot more choices back then.
The new trend that developed this year is a sharp decrease in the number of homes coming on the market. For the month of September, there were 2,301 new FOR-SALE signs in Orange County, 728 fewer than the 3-year average prior to COVID (2017 to 2019), 24% less. So far in 2022, there have been 6,208 missing signs, down 19%. These missing signs counter the potential rise in the inventory.
Demand
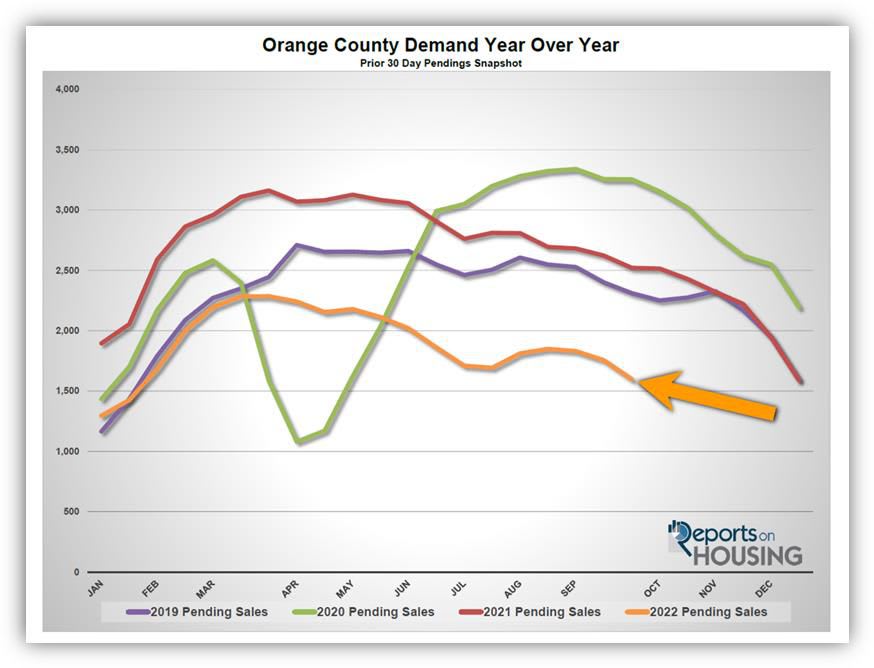
Demand plunged by 9% in the past couple of weeks.
Demand, a snapshot of the number of new escrows over the prior month, decreased from 1,756 to 1,598 in the past couple of weeks, shedding 158 pending sales, or down 9%. It was second largest drop in 2022 behind June 23rd’s 159 plunge in pending sales. As rates continue to soar higher, fewer, and fewer buyers continue to actively pursue a home. These are the lowest levels for a start to October since 2007, the start to the Great Recession. Do not confuse this downturn in activity as a signal that this is the beginning of another large, catastrophic drop in values with a flood of foreclosures and short sales. The current market is completely different where homeowners are coming from a position of strength, there is no panic selling, and inventories are still severely muted. Expect demand to continue to slowly fall from now to Thanksgiving unless there is another major change in mortgage rates.
Last year, demand was at 2,521, 58% more than today, or an extra 923. The 3-year average prior to COVID (2017 to 2019) was at 2,262 pending sales, 42% more than today, or an extra 664.
With demand dropping faster than supply, the Expected Market Time (the number of days to sell all Orange County listings at the current buying pace) increased from 62 to 68 days in the past couple of weeks. Last year the Expected Market Time was at 26 days, substantially faster than today and home values were screaming higher. The 3-year average prior to COVID was at 86 days, a bit longer than today.
Luxury End
The luxury housing market continued to cool considerably in the past couple of weeks.
In the past couple of weeks, the luxury inventory of homes priced above $2 million decreased from 804 to 797 homes, down 7 homes, or 1%. Luxury demand decreased by 23 pending sales, down 14%, and now sits at 145, its lowest level since January. With demand plunging compared to the slight drop in supply, the overall Expected Market Time for luxury homes priced above $2 million increased from 144 to 165 days, its highest reading since January 2021. With the instability of financial markets and Wall Street, and stubbornly high rates, expect the luxury market to continue to slow.
Year over year, luxury demand is down by 112 pending sales or 44%, and the active luxury listing inventory is up by 274 homes or 52%. The Expected Market Time last year was at 61 days, much stronger than today.
For homes priced between $2 million and $4 million, the Expected Market Time in the past two weeks increased from 113 to 133 days. For homes priced between $4 million and $8 million, the Expected Market Time decreased from 220 to 215 days. For homes priced above $8 million, the Expected Market Time increased from 325 to 454 days. At 454 days, a seller would be looking at placing their home into escrow around December 2023.
Orange County Housing Summary
- The active listing inventory in the past couple of weeks increased by 8 homes, nearly unchanged, and now sits at 3,646. In September, there were 24% fewer homes that came on the market compared to the 3-year average prior to COVID (2017 to 2019), 728 less. Last year, there were 2,179 homes on the market, 1,467 fewer homes, or 40% less. The 3-year average prior to COVID (2017 to 2019) was 6,400, or 76% more.
- Demand, the number of pending sales over the prior month, plunged by 158 pending sales in the past two weeks, down 9%, and now totals 1,598. It is the lowest reading for a start to October since 2007. Last year, there were 2,521 pending sales, 58% more than today. The 3-year average prior to COVID (2017 to 2019) was 2,262, or 42% more.
- With demand plunging, the Expected Market Time, the number of days to sell all Orange County listings at the current buying pace, increased from 62 to 68 days in the past couple of weeks. It was at 26 days last year, much stronger than today.
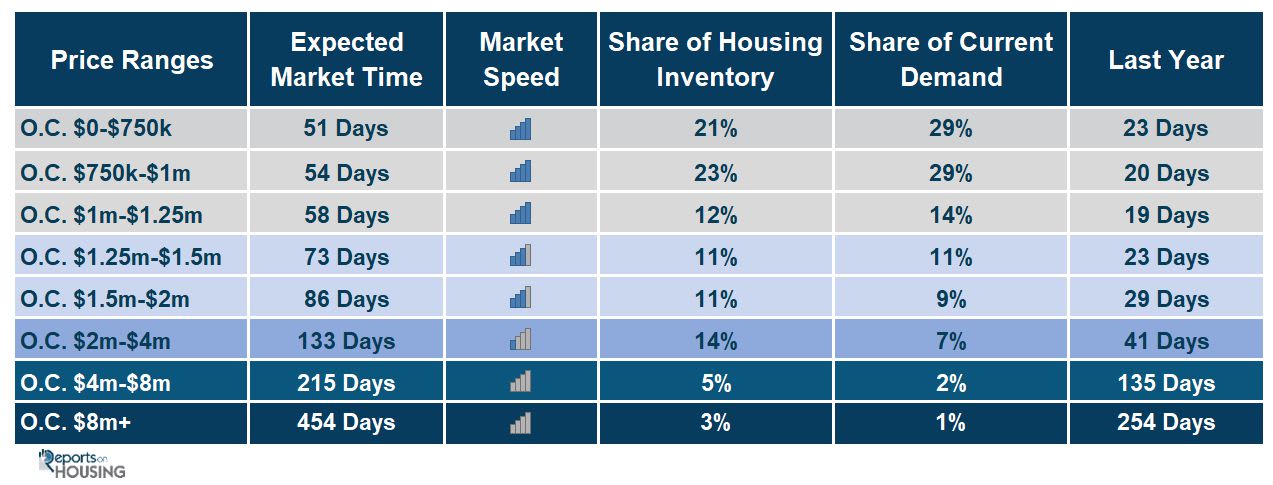
- For homes priced below $750,000, the Expected Market Time increased from 43 to 51 days. This range represents 21% of the active inventory and 29% of demand.
- For homes priced between $750,000 and $1 million, the Expected Market Time increased from 51 to 54 days. This range represents 23% of the active inventory and 29% of demand.
- For homes priced between $1 million to $1.25 million, the Expected Market Time increased from 54 to 58 days. This range represents 12% of the active inventory and 14% of demand.
- For homes priced between $1.25 million to $1.5 million, the Expected Market Time increased from 62 to 73 days. This range represents 11% of the active inventory and 11% of demand.
- For homes priced between $1.5 million to $2 million, the Expected Market Time increased from 85 to 86 days. This range represents 11% of the active inventory and 9% of demand.
- For homes priced between $2 million and $4 million, the Expected Market Time in the past two weeks increased from 113 to 133 days. For homes priced between $4 million and $8 million, the Expected Market Time decreased from 220 to 215 days. For homes priced above $8 million, the Expected Market Time increased from 325 to 454 days.
- The luxury end, all homes above $2 million, accounts for 23% of the inventory and 10% of demand.
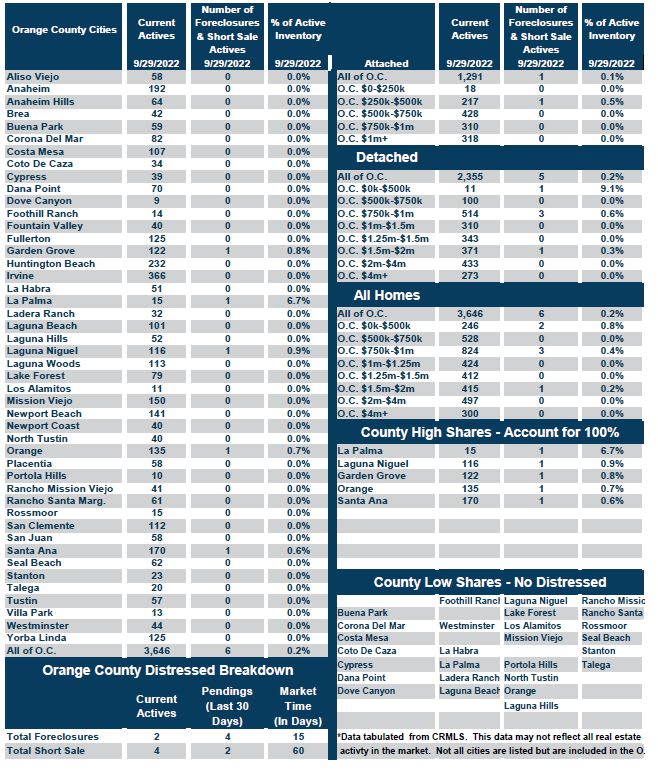
- Distressed homes, both short sales and foreclosures combined, made up only 0.2% of all listings and 0.4% of demand. There are only 2 foreclosures and 4 short sales available to purchase today in all of Orange County, 6 total distressed home on the active market, down 2 from two weeks ago. Last year there were 11 total distressed homes on the market, similar to today.
- There were 2,168 closed residential resales in August, 30% less than August 2021’s 3,119 closed sales. August marked an 11% increase compared to July 2022. The sales to list price ratio was 99.0% for all of Orange County. Foreclosures accounted for 0.1% of all closed sales, and there were no short sales. That means that 99.9% of all sales were good ol’ fashioned sellers with equity.
Have a great week.
Sincerely,
Steven Thomas
Quantitative Economics and Decision Sciences
Copyright 2022- Steven Thomas, Reports On Housing - All Rights Reserved. This report may not be reproduced in whole or part without express written permission by author.